Baseline Assessment
Understand your city’s waste flow and identify priorities for intervention.
This guidance was developed by WWF to support cities as they proceed with their first actions following the signing of their Declaration of Intent. It is not intended to be prescriptive, as cities themselves are best positioned to decide how to conduct their activities, given local challenges, resources and capabilities.
This guidance was developed in an effort to create a standard methodology that can be easily and cost effectively replicated across all cities and regions, to enable long-term monitoring and evaluation towards PSC defined plastic targets. This is an evolving guide that will change over time to reflect lessons learned, especially from the key pilot cities that WWF is working closely with across Asia and other regions where customised baseline methodologies have been developed alongside the Cities’ councils.
A baseline assessment provides information on current conditions in which the city seeks to change. It provides a critical reference point for assessing changes and impact over time, as it establishes a basis for comparing the situation before and after interventions, and for making inferences as to the effectiveness of the initiative.
Baseline assessments are most useful when conducted before the City Action Plan is developed, and before interventions are adopted and implemented, so as to serve as a benchmark for monitoring and evaluating change, as well as to guide and inform priorities and decisions.
Baseline assessments should be carried out in a methodical way, ensuring that the same type of data can be collected at different stages in time, in order to compare the results and assess the extent of change, or lack thereof. The type of data to be collected and considered in the baseline is dependent on a number of factors, including, but not limited to, the existing waste management infrastructure, level of informal sector inclusion, current available waste data, the key performance or change indicators expected to be included in the Monitoring and Evaluation methodology, as well as the specific requirements defined within the scope of a project, which can include donor requirements.
Baseline assessments for PSC intents and purposes, can focus on two separate, but closely related assessments:
- Waste Flow Scoping Assessment – assessment of solid waste generation, collection and management, identifying a city’s waste management processes, capabilities and possible leakage into the environment; and/or
- Litter Baseline Assessment – community-level data on plastic leakage into the environment, obtained through litter data collection in the field. Litter is defined in this context as plastic waste materials that have been discarded improperly, in an inappropriate location, either intentionally or unintentionally.
While both assessments are recommended, and can be complementary to each other, it is entirely up to the city to decide which types of assessments will best meet its baseline objectives, based on available data, funding, and resources.
In both types of assessments, we must be cognizant of our monitoring capabilities. In instances where we collect robust datasets in our baseline assessments, but cannot collect equivalent datasets through follow-on monitoring efforts, then the baseline can quickly become irrelevant, as there are no mechanisms to measure the effectiveness of interventions and investments. A more streamlined baseline assessment, one that adheres to a monitoring methodology that can be easily and cost effectively replicated, is preferred over an exhaustive baseline assessment that cannot be practicably replicated.
While there are many credible baseline assessment methodologies that can be used to collect community-level data to inform and guide a city’s PSC approach, given limited time and dedicated resources, we make an effort to define clear boundaries to focus the scope of the assessment.
A fully comprehensive baseline assessment can include seven community components:
- inputs
- consumption
- product design
- use
- collection
- end-of-cycle management (including collection and waste management)
- plastic leakage into the environment.[1]
While all components are relevant to a comprehensive plastics strategy, the upstream components, from inputs through to the use phase, fall outside the scope of our recommended baseline assessment. We therefore suggest a baseline focus on end-of-cycle components (components 5-7 mentioned above) to include at minimum plastic collection, management and leakage – downstream data that can be leveraged to inform local policies and interventions.
Secondary components that can also be obtained and used to inform local activities can include data on plastics use, in an effort to better understand how plastic waste is generated at the community-level.
The ultimate measure for the success of the PSC initiative is the reduction of plastic leakage into the environment. Inline with this objective, Cities join the PSC initiative and commit to two targets:
- Achieving a 30% reduction in plastic leakage in the near term;
- No plastics in nature by 2030
The No Plastics in Nature by 2030 target will require 100% collection rates, full containment and processing capabilities, it is the 30% reduction target that is most relevant to our baseline methodology in the near term.
While the ultimate plastic leakage baseline measure is kg of plastic waste leaked into nature, per capita, per year (kg/capita/year), this can be a challenging number to quantify with a high degree of confidence. Possible alternative quantification approaches can include plastic item counts and/or weighted volumes in specific target areas.
Find out more about how you can measure litter data in a computational manner, or how a Waste Flow Scoping Assessment can provide key insights concerning leakage — download the Plastic Smart Guide for more details.
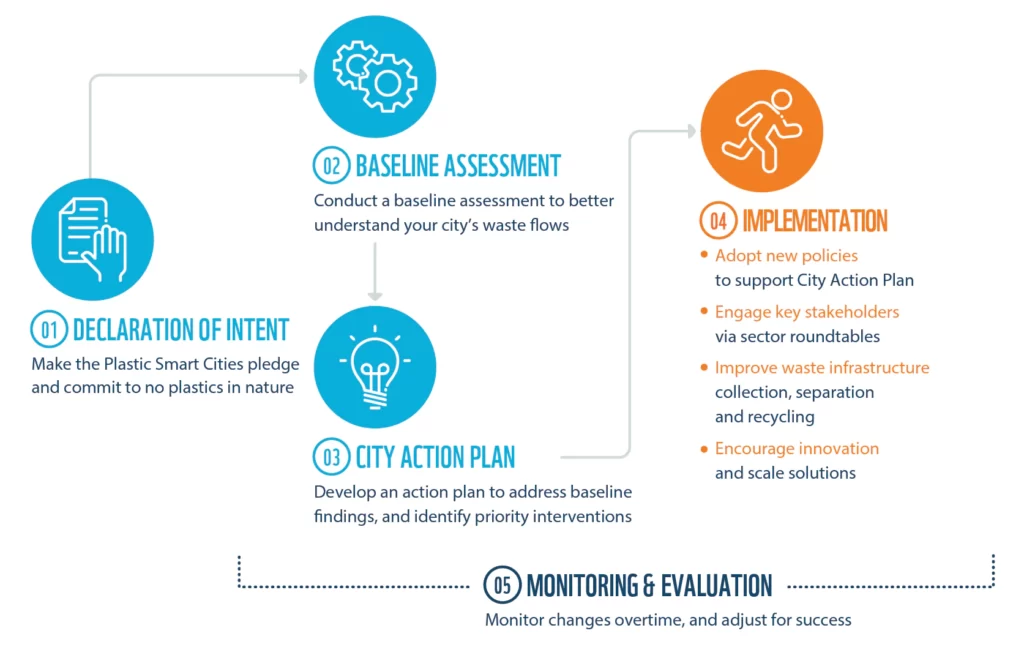
Plastic Smart Cities Framework
Follow the journey to becoming a Plastic Smart City.
Click on the steps below find out more about other steps in the framework.
Learn to conduct a baseline assessment for your city
Download the Plastic Smart Guide for Cities for a step-wise approach.